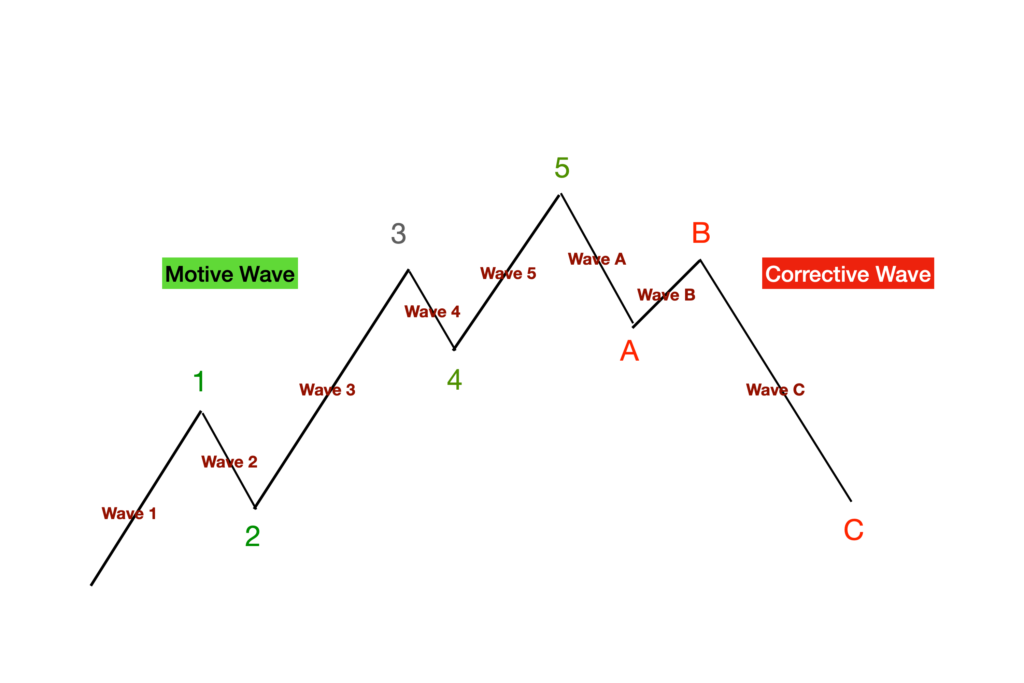
In the 1930s, almost over a hundred years ago now, Ralph Nelson Elliott , an accountant , started reviewing and researching stock market data and found that there is a certain pattern to the index movement which repeats itself and in many time frames. These patterns are called Elliott waves. R. N Elliott reviewed and studied Dow Index data of almost 75 years, without any computer or softwares , manually in all time frames from years down to half an hour and drew characteristics of these repeated patterns as Wave principles. According to him, maret has only two phases that repeats in the form of continuous waves, where the end of one wave is the beginning of another wave. The first phase of wave is called the motive phase which always moves in the direction of larger trend of the market and the second phase is called the corrective phase. Motive wave has 5 sub-waves as part of the structure and the corrective phase is made of 3 sub-waves in the opposite direction of the larger trends of the market.
As is shown in the figure below, Motive waves are labeled 1 though 5 and Corrective waves are labeled A though C.
Lorem ipsum dolor sit amet, consectetur adipiscing elit. Ut elit tellus, luctus nec ullamcorper mattis, pulvinar dapibus leo.
Login
Accessing this course requires a login. Please enter your credentials below!